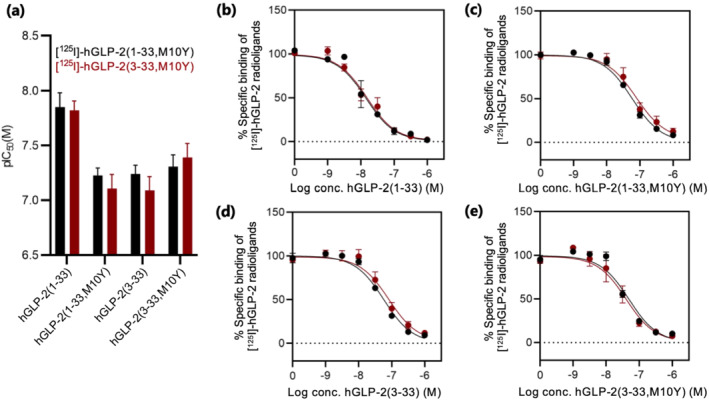
FIGURE 3.

Heterologous competition binding using radiolabelled hGLP‐2(1–33,M10Y) and hGLP‐2(3–33,M10Y). (a) Bar chart of the pIC50 values for binding of [125I]‐hGLP‐2(1–33,M10Y) (black) and [125I]‐hGLP‐2(3–33,M10Y) (red). (b–e) Competition binding of [125I]‐hGLP‐2(1–33,M10Y) (black) and [125I]‐hGLP‐2(3–33,M10Y) (red) displaced by increasing concentrations of (b) hGLP‐2(1–33) (n = 5), (c) hGLP‐2(1–33,M10Y) (n = 5 for [125I]‐hGLP‐2(1–33,M10Y) and n = 6 for [125I]‐hGLP‐2(3–33,M10Y)), (d) hGLP‐2(3–33) (n = 5 for [125I]‐hGLP‐2(1–33,M10Y) and n = 6 for [125I]‐hGLP‐2(3–33,M10Y)) and (e) hGLP‐2(3–33,M10Y) (n = 5). To compensate for inter‐assay variations data were normalized to the specific binding of each ligand, against each of the radioligands, at the hGLP‐2 receptor within each assay
