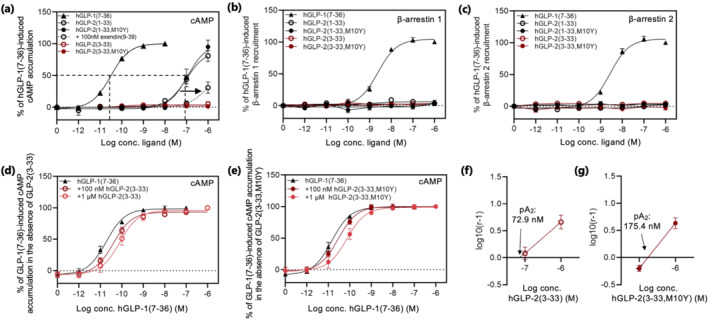
FIGURE 5.

Activity of the hGLP‐2 variants at the hGLP‐1 receptor. Dose–response curves in (a) cAMP accumulation, (b) β‐arrestin 1 recruitment and (c) β‐arrestin 2 recruitment for the hGLP‐1 receptor stimulated with increasing concentrations of hGLP‐1(7–36), hGLP‐2(1–33), hGLP‐2(1–33,M10Y) (plus/minus 100 nM exendin(9–39) in (a)), all in black, hGLP‐2(3–33) and hGLP‐2(3–33,M10Y), both in red. cAMP accumulation dose–response curves for hGLP‐1(7–36) in the presence of 100 nM and 1 μM (d) hGLP‐2(3–33) or (e) hGLP‐2(3–33,M10Y) and the corresponding Schild plots shown in (f) hGLP‐2(3–33) and (g) hGLP‐2(3–33,M10Y) with pA2 values. To compensate for inter‐assay variations, data were normalized to hGLP‐1(7–36) within each experiment
