Figure 5.

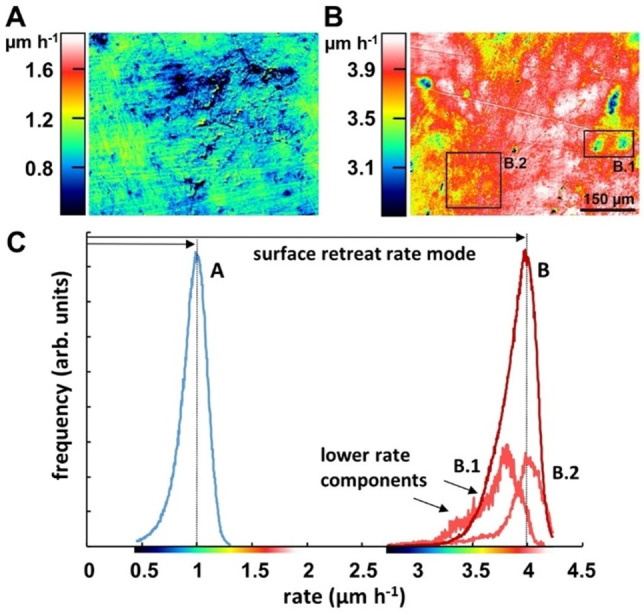
(A,B) Degradation rate maps and histograms of G‐PET films after exposure for 1 h with LCC (A) and PHL7 (B). (C) Rate distribution curves of (A) and (B) indicating different retreat rate modes of 1.0 μm h−1 for LCC compared to 4.0 μm h−1 for PHL7. Although both rate histograms are moderately skewed left, the degradation rate distribution observed with PHL7 (B) shows a larger variability of the lower rate portions, exemplified by the map and rate histograms of sections B.1 and B.2. For better visibility, the graphs of B.1 and B.2 are vertically magnified.
