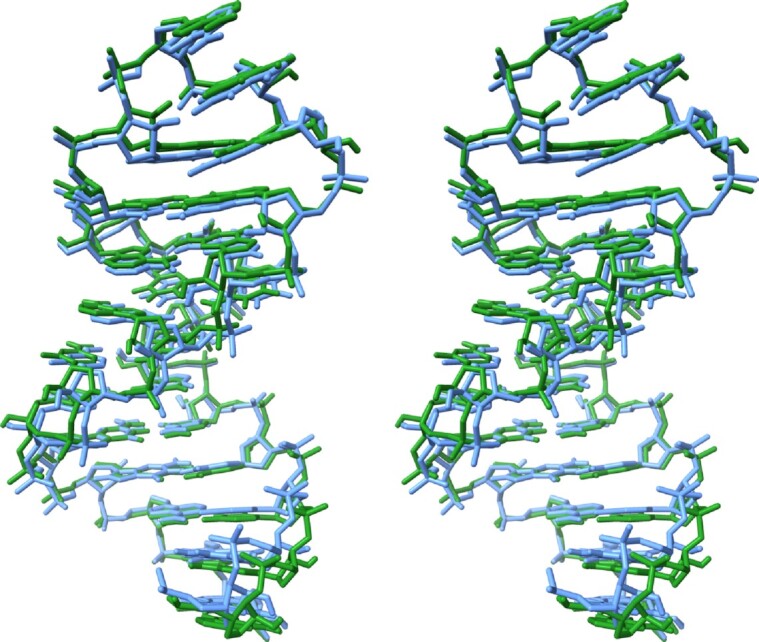
Figure 5.

Stereo plot displaying a superposition of the SRL crystal structure (light blue), residues G48 through U72, with the ensemble-averaged simulation structure over the full 10 μs trajectory (green). The terminal U47•G73 ‘base pair’ is omitted in this overlay, as these terminal bases are highly mobile and disordered during most of the trajectory. The G48•U72 pair is at the bottom and the GAGA tetraloop is at the top.
