
FIG. 4.
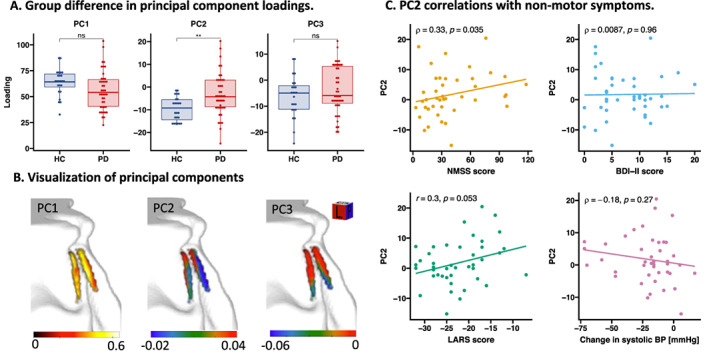
Principal component analysis. Principal component analysis was applied on CNRMTw maps from all participants to investigate patterns of disease‐related changes in LC CNRMTw. Loadings on PC2 reflecting a gradient along the rostro‐caudal and dorso‐ventral axes of the nucleus were different across groups (A). This gradient (visualized in B) was found to correlate with overall nonmotor symptom severity (NMSS) and a trend was observed toward a correlation with apathy (LARS), but not with depression (BDI‐II score) or orthostatic change in systolic BP (C). BDI‐II, Beck's Depression Inventory II; BP, blood pressure; CNRMTw, contrast‐to‐noise ratio of the magnetization transfer weighted signal; HC, healthy, age‐matched controls; LARS, Lille Apathy Rating Scale; LC, locus coeruleus; NMSS, Non‐Motor Symptom Scale; ns, nonsignificant; PC1, principal component 1; PC2, principal component 2; PC3, principal component 3; PD, Parkinson's disease. [Color figure can be viewed at wileyonlinelibrary.com]