Figure 3.
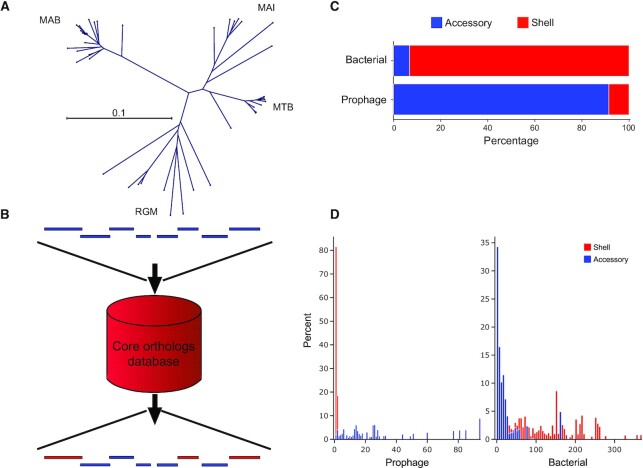
DEPhT employs MMseqs2 to identify and mask shell mycobacterial genes from predicted prophage regions. (A) The gene content of prophage-free Mycobacterium genomes was compared using MMseqs2 and sorted into four clades corresponding to M. abscessus (MAB), M. tuberculosis (MTB), M. avium-intracellulare (MAI) complexes, and rapid growing Mycobacterium (RGM) as depicted by an unrooted phylogenetic tree. Separate MMseqs2 databases were constructed for each clade for use in the shell/accessory classifier. (B) Schematic representation of the shell/accessory classifier which catalogues genes as being either bacterial orthologs or accessory genes. Bacterial genes, red; prophage genes, blue. (C) Validation of the shell/accessory classifier using 10 M. abscessus genomes (Supplementary Table S4) shows the proportion of either known bacterial or known prophage genes as being classified as shell or accessory genes. (D) Distribution of shell and accessory gene island sizes across regions known to be either prophage or bacterial. For every identified shell gene from content contributed by a prophage in 10 M. abscessus genomes (Supplementary Table S4), the size of the gene island it belongs to was plotted as a histogram (left; red), where the height of each bin in the histogram corresponds to the percentage of the total prophage genes. A similar histogram (left; blue) was plotted in the adjacent spaces for accessory gene content contributed by a prophage. The right histograms are the same representations for gene content not contributed by a prophage, where again a histogram (right; red) is plotted for shell gene content and an adjacent histogram (right; blue) is plotted for accessory gene content.

