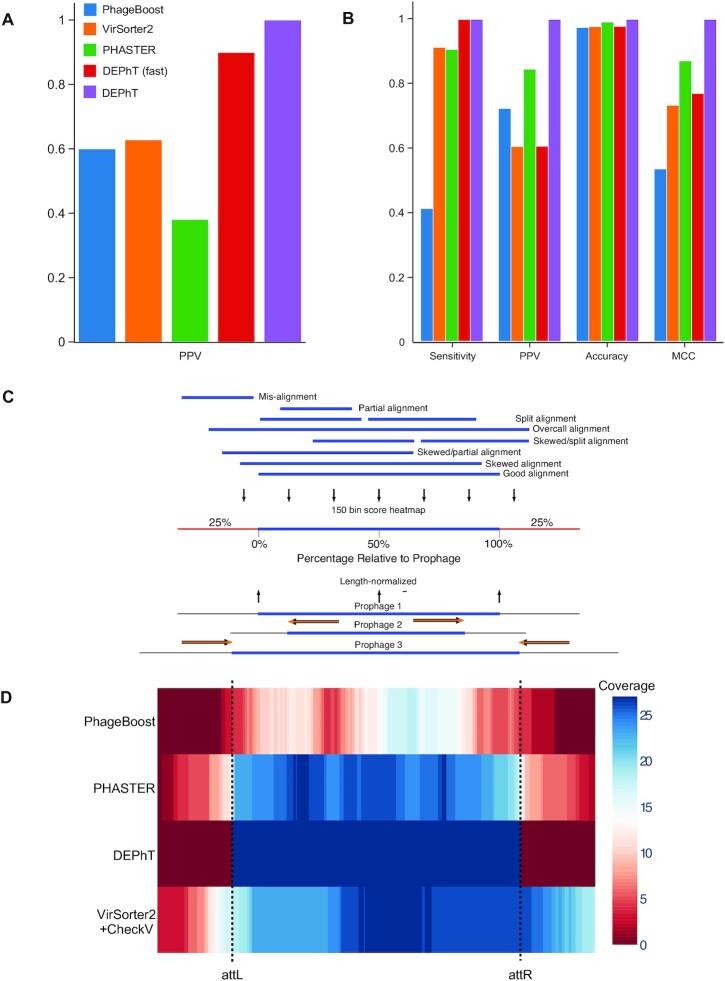
Figure 6.
DEPhT discovers, discriminates, and extracts prophage signal deftly. (A) The positive predictive value (PPV) of the outputs for PHASTER, VirSorter2 supplemented with CheckV, PhageBoost, DEPhT (fast mode) and DEPhT (normal mode) for prophage discovery is displayed as a bar graph. PPV for prophage discovery was calculated as the number of manually identified prophages discovered by a program divided by the total number of prophage-like regions reported. (B) The sensitivity, PPV, accuracy, and Matthew's correlation coefficient were determined on a nucleotide basis for the same outputs and displayed as a multi-bar graph, using the same color scheme. For prophage extraction, true positives (TP) are calculated as the total nucleotide base pairs (bp) reported within a prophage region that belong to a manually identified prophage, true negatives (TN) is calculated as the total bp not reported in a prophage region that do not belong to a manually identified prophage, false positives (FP) are calculated as the total bp that is reported within a prophage region that belong to a manually identified prophage, and false negatives (FN) are calculated as the total bp not reported in a prophage region that do not belong to a manually identified prophage. Sensitivity is calculated as  positive predictive value (PPV) is calculated as
  , Accuracy is calculated as
  , and Matthew's Correlation Coefficient is calculated as (
 (C) A schematic representation of how predicted prophage regions align to true prophages is shown. At the bottom three known prophage are depicted of different lengths, and these are length normalized, to a scale of 0–100%, together with flanking sequences corresponding to 25% of genome length at each side. Examples of how predicted prophage regions may correspond to the actual prophage are shown above, including good alignment and multiple ways in which the alignment is imperfect. To quantify these alignments, each sequence is divided into bins, with the normalized true prophages forming 150 bins. If the predicted sequence aligns with a bin then it receives a positive score, and these score are summed and represented as a heat map, as shown in panel D. (D) Prophage discovery length-normalized coverage for binned regions of manually identified prophages from 10 M. abscessus strains (Supplementary Table S4) were plotted as a heatmap for the outputs of PHASTER, VirSorter2 supplemented with CheckV, PhageBoost and DEPhT, using the method depicted in panel C. Coverage for a particular nucleotide region bin was assigned if the cumulative output for the whole region was recognized as part of a prophage at least once, where coverage is represented on a red to blue color gradient with blue representing the most coverage.

