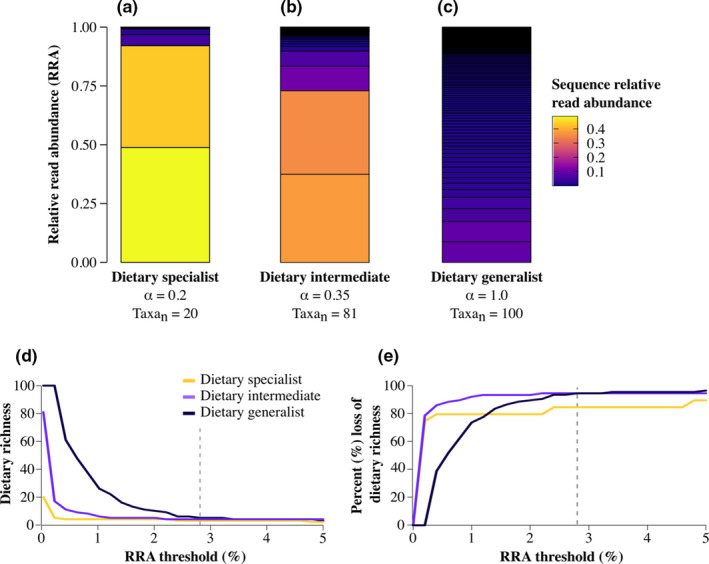
FIGURE 1.

Different impacts of RRA thresholds on simulated specialist and generalist diets. The dietary profiles of a (a) specialist, (b) intermediate, and (c) generalist feeder as simulated using Pareto distributions. When the shape parameter (α) and total number of food taxa (Taxan) are low, there is a large skew in the rank‐abundance distribution (i.e., few food taxa with high relative abundance); increasing these values increases the richness and evenness of the dietary profile (i.e., many food taxa, each with lower relative abundance). In each stacked barplot, the color of each segment represents the relative abundance of each simulated taxon in the diet profile. Increasing the threshold from 0% to 5% for each diet profile resulted in differential impacts on the (d) inferred dietary richness and (e) % loss of initial dietary richness from each sample. A 2.8% threshold (grey dashed lines in d and e) results in similar levels of inferred dietary richness and % losses of taxa across samples
