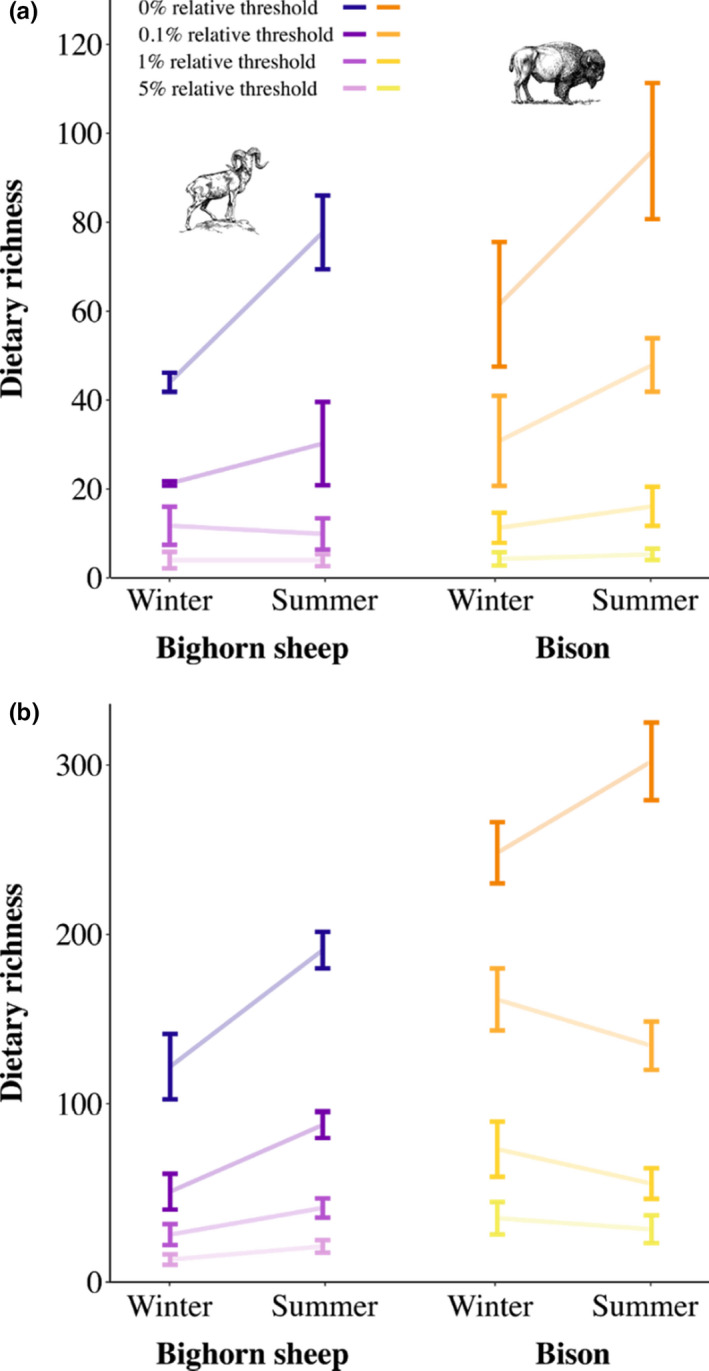
FIGURE 3.

Thresholds altered ecological patterns in dietary DNA metabarcoding data. We compared (a) mean dietary richness and (b) total population‐level dietary richness of bighorn sheep and bison in summer and winter. Total population‐level dietary richness was estimated for winter and summer based on extrapolation to double the minimum seasonal sample size for each species (N = 8 bighorn sheep; N = 20 bison). Error bars represent (a) standard deviations and (b) 95% upper and lower confidence intervals. In all plots, lines connect mean dietary richness for winter and summer at each relative threshold
