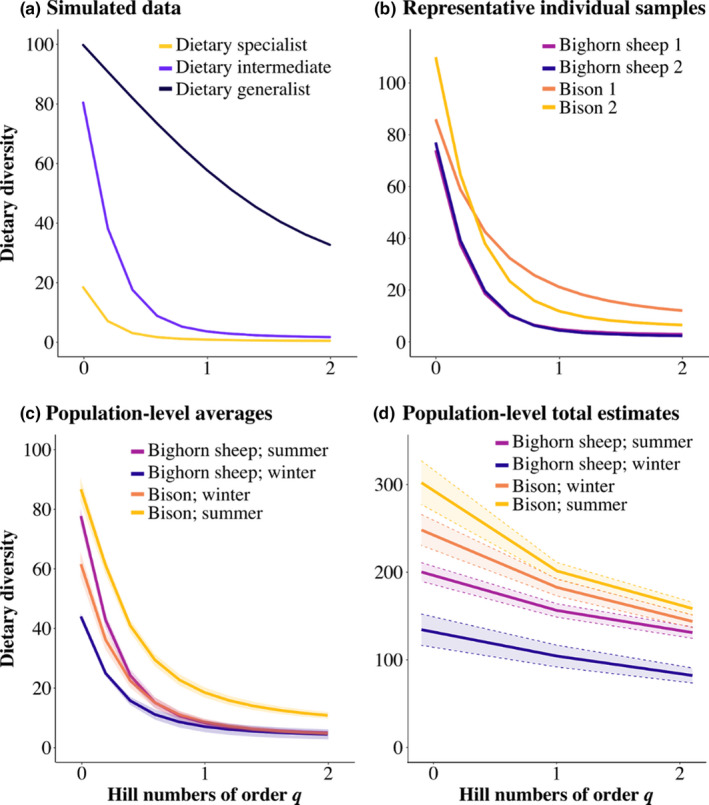
FIGURE 4.

Hill numbers applied to both simulated and real dietary DNA metabarcoding data. All curves show a decline in apparent dietary diversity with increasing q due to the increasing emphasis on abundant taxa. Curves show how sensitive each set of diet profiles is to increasing q based on (a) simulated dietary profiles using different Pareto distributions (Figure 1), (b) a set of representative samples from Yellowstone (Figure 2), (c) the average population‐level values from Yellowstone (Figure 3a), and (d) the total population‐level estimated values from Yellowstone (Figure 3b). In contrast to the effect of applying RRA thresholds to the same data, these curves convey more information about the relative abundance of both common and rare taxa while retaining clearer rank‐order of samples
