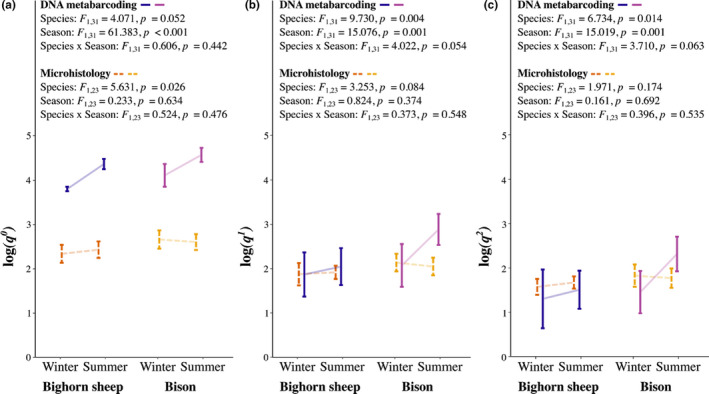
FIGURE 5.

Seasonal changes in dietary diversity based on DNA metabarcoding and microhistology. For both bighorn sheep and bison, we compare log‐transformed (a) dietary richness (q 0), (b) the number of “typical” (q 1), and (c) the number of dominant (q 2) plant taxa identified in DNA metabarcoding data (dark solid lines) and microhistology data (light dashed lines). Lines connect the mean values with error bars that represent standard deviations. For microhistological analysis, when multiple samples were collected per herd per season, these samples were pooled into a composite scan of fecal material
