FIGURE 2.

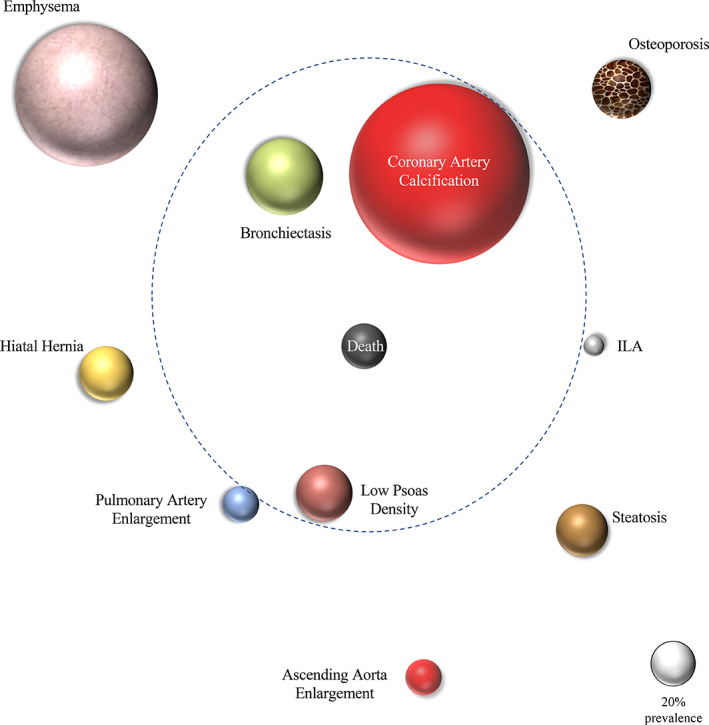
‘Computed tomography (CT)‐comorbidome’: an orbital bubble chart showing the prevalence of the 10 CT‐assessed comorbidities and the strength of their association with all‐cause mortality

‘Computed tomography (CT)‐comorbidome’: an orbital bubble chart showing the prevalence of the 10 CT‐assessed comorbidities and the strength of their association with all‐cause mortality