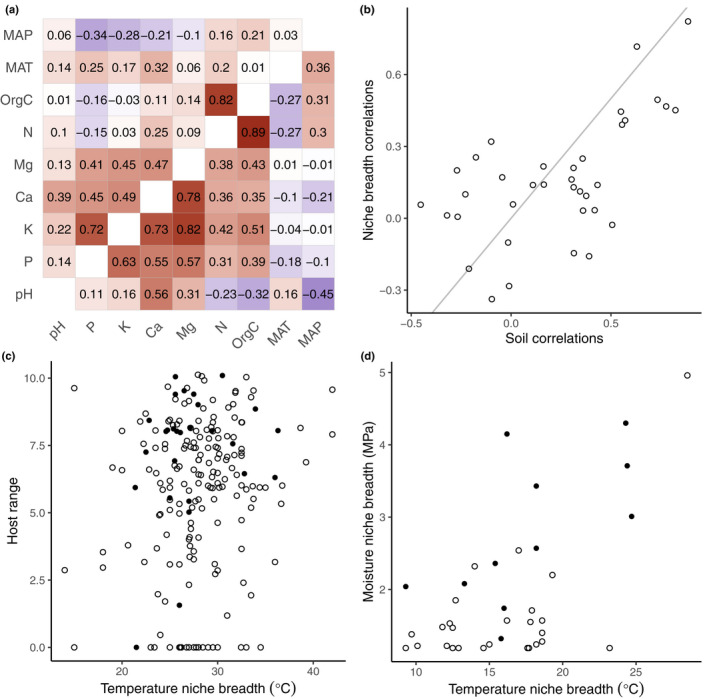
Fig. 2.

Niche breadth correlations. (a) Heat map with niche breadth correlations in upper triangle and soil property correlations in lower triangle for arbuscular mycorrhizal fungi (AMF) (data from Davison et al., 2021). For example, soil organic carbon (OrgC) niche breadth is strongly correlated with soil nitrogen (N) niche breadth (r = 0.82, upper triangle). However, soil OrgC is also strongly correlated with soil N content (r = 0.89, lower triangle). Red indicates a positive correlation, blue a negative correlation. MAP, mean annual precipitation; MAT, mean annual temperature. (b) Niche breadth correlations vs soil property correlations for all pairs of variables in (a). Pearson correlation 0.59 (bootstrap percentile 95% confidence interval 0.35–0.77). Line of equality in grey. (c) Host range vs temperature niche breadth (growth in culture) for fungal (open circles) and oomycete (closed circles) pathogens of plants (data from Chaloner et al., 2020). Host range is the log‐transformed phylogenetic diversity of known host plants. Pearson correlation 0.14 (bootstrap 95% CI 0.00–0.26). (d) Moisture niche breadth vs temperature niche breadth for AMF (data from Maynard et al., 2019). Pearson correlation 0.60 (bootstrap 95% CI 0.26–0.80).
