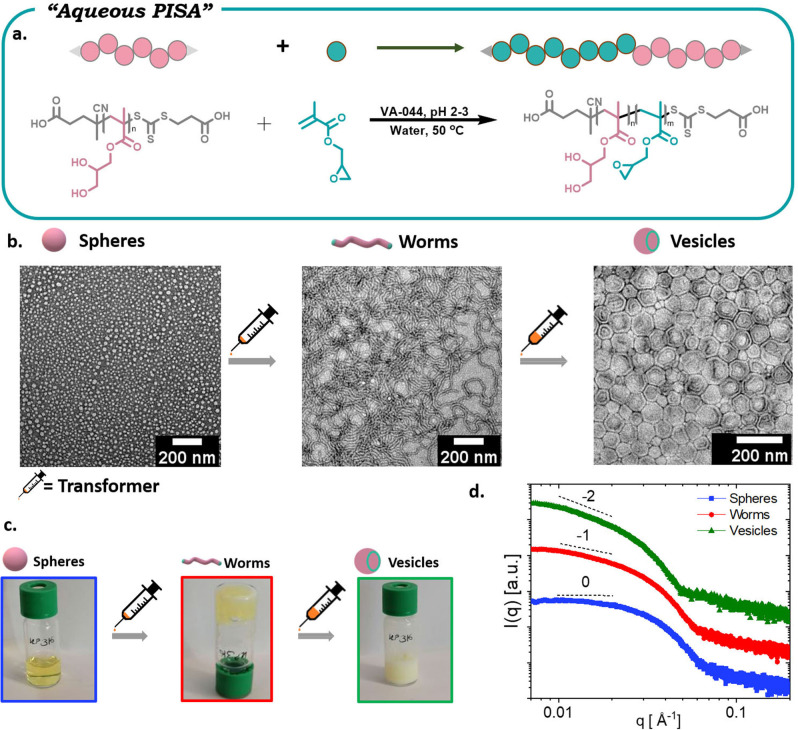
Figure 3.
TIM of polymeric nanoparticles obtained via aqueous PISA. a) Schematic representation of RAFT emulsion polymerization; b) TEM images of spheres, worms and vesicles; c) visual representation of various morphologies; d) small‐angle X‐ray scattering data confirming the formation of different morphologies in bulk.

