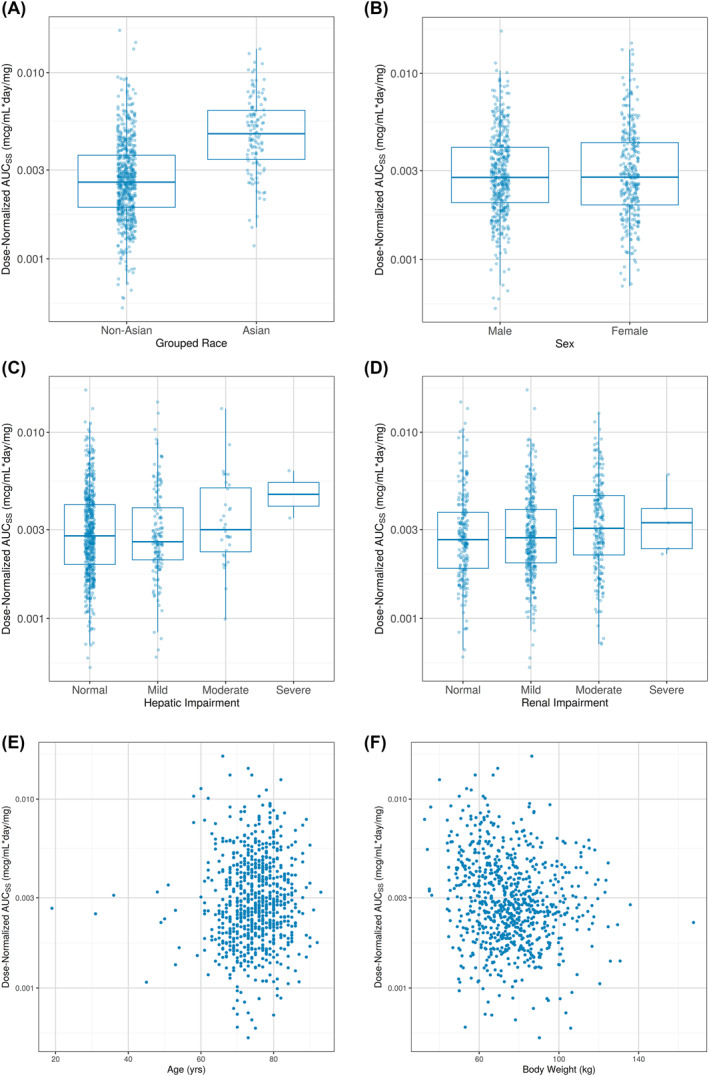
FIGURE 1.

Boxplots and Scatterplots of Post Hoc Dose‐Normalized area under the plasma concentration‐time curve at steady‐state (AUCss) by Categorical and Continuous Covariates, respectively. Venetoclax AUCs s values, normalized for designated cohort dose, are plotted versus categorical covariates (A–D) or continuous covariates (E, F). (A) Asian versus Non‐Asian; (B) Sex; (C) Hepatic Impairment; (D) Renal Impairment; (E) Age; and (F) Body Weight
