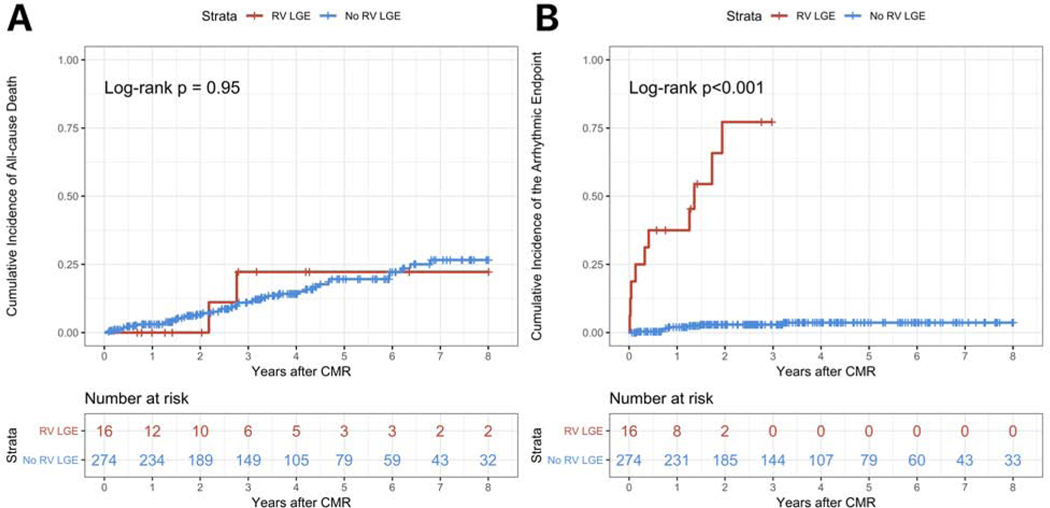
Figure 2. Kaplan-Meier analyses for the study endpoints for RV LGE on CMR.
Panel A shows the cumulative incidence of all-cause death for patients with RV LGE (red line) versus those with no RV LGE (blue line). Panel B shows the cumulative incidence of the arrhythmic endpoint for patients with RV LGE (red line) versus those with no RV LGE (blue line). Each vertical tick on the curves displays a censored patient. See the text for further details.

