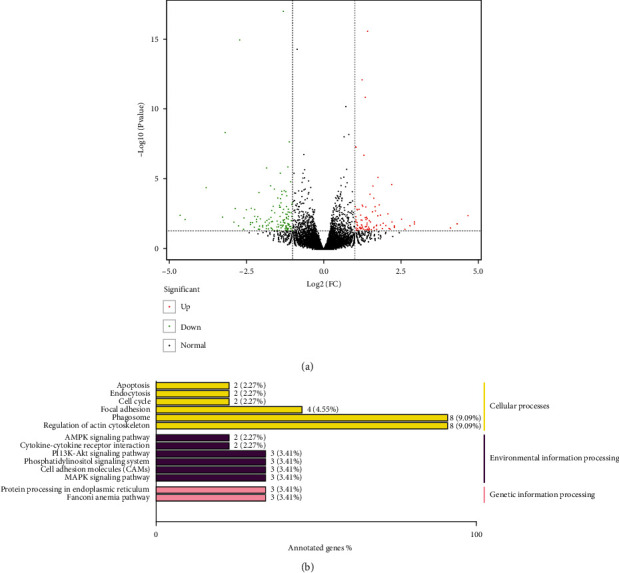
Figure 4.

Transcriptome and pathway analysis of HUMSC-sEV treatment. (a) Volcano plot of DEGs between HUMSC-sEV-treated HCECs and HUMSC-sEV-untreated HCECs. Dots in green stand for downregulated DEGs, red dots mean upregulated DEGs, and black dots are nonsignificant DEGs. (b) The KEGG annotation results of the DEGs were classified according to the pathway types in KEGG. DEG: differentially expressed gene; KEGG: Kyoto Encyclopedia of Genes and Genomes.
