
. 2022 Jan 31;49(4):476–494. doi: 10.1111/joor.13303
© 2022 The Authors. Journal of Oral Rehabilitation published by John Wiley & Sons Ltd.
This is an open access article under the terms of the http://creativecommons.org/licenses/by/4.0/ License, which permits use, distribution and reproduction in any medium, provided the original work is properly cited.
FIGURE 2.
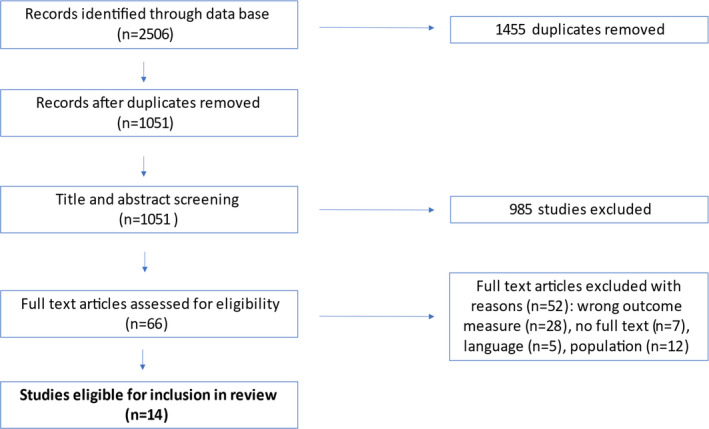
PRISMA flowchart of included and excluded studies