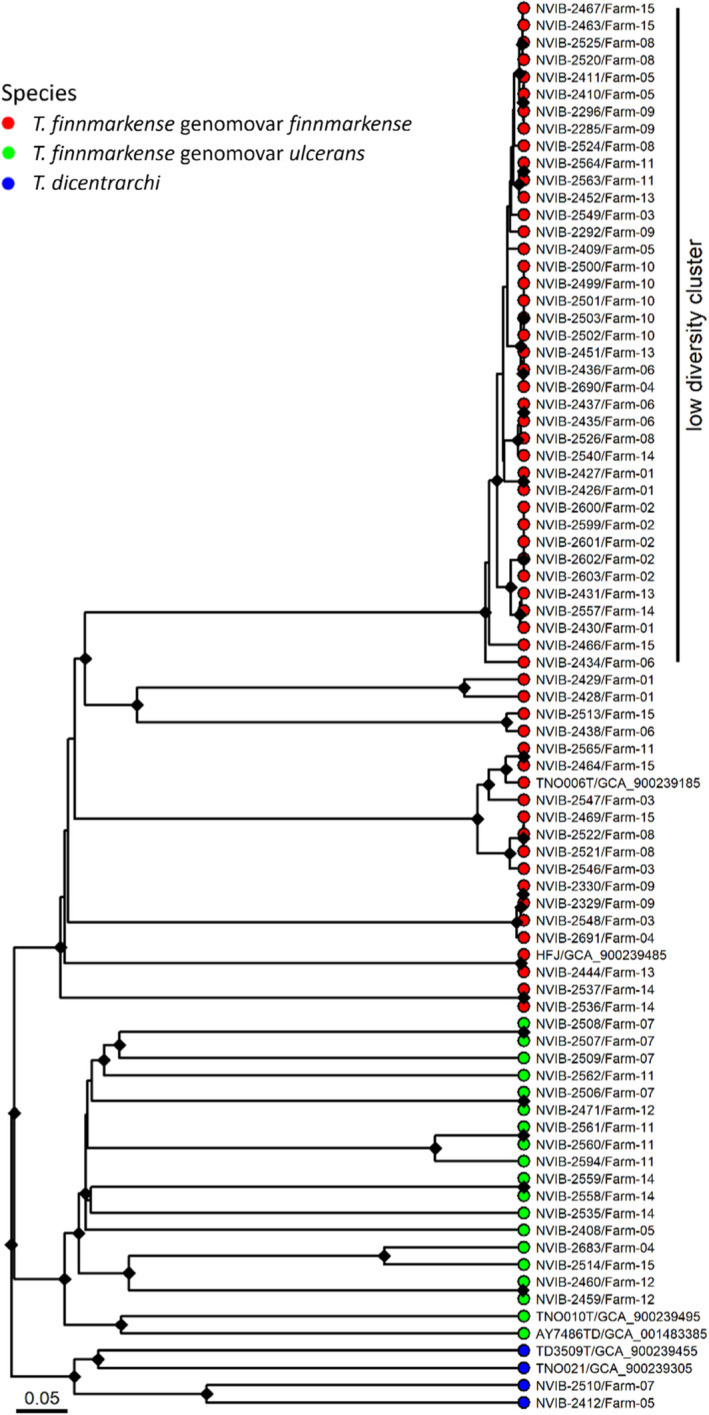
FIGURE 3.

Relationships between the sequenced strains and NCBI reference strains analysed by core genome MLST. The low‐diversity cluster is labelled. The different species in the dendrograms are visualized with different tip point colours; T. finnmarkense genomovar finnmarkense in red, T. finnmarkense genomovar ulcerans in green and T. dicentrarchi in blue. The references are labelled with strain designations and accession numbers. The cgMLST dendrogram is based on hierarchical clustering of alleles of 1802 core genes for each strain using chewBBACA. Bootstrapping was performed with 1000 replicates and nodes with bootstrap support above 95% are labelled with a black diamond. The bar describes normalized UPGMA distance (0.05 roughly equals 90 alleles difference)
