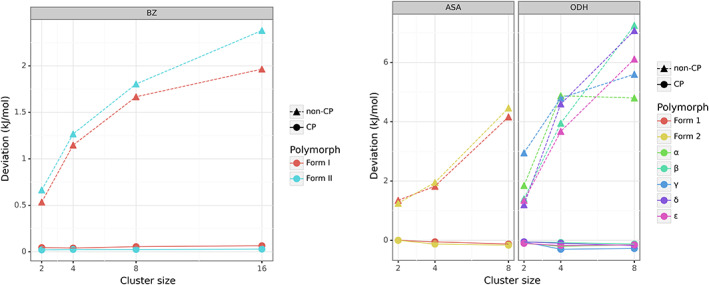
FIGURE 5.

Behavior of average raw deviations (kJ mol−1) of non‐CP and CP‐corrected HF/cc‐pVTZ interaction energies with increasing cluster size and basis set in the MBC‐36 complexes. CP corrected HF/cc‐pVQZ interaction energies were taken as the benchmark
