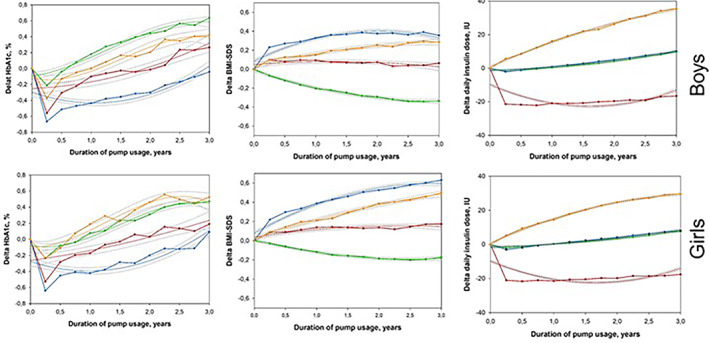
FIGURE 3.

Multitrajectories of changes of glycemic control (HbA1c), age‐ and sex‐adjusted BMI (BMI‐SDS), and daily insulin dose with 95% CIs over 3 years following insulin pump therapy initiation for boys and girls separately. Trajectory variables are presented as the differences (Delta) between quarterly aggregated values at each time point [i] and the respective baseline value, for example, Delta HbA1c [i] = HbA1c [i]—(Baseline HbA1c). A positive value indicates that the measurement was higher at the specific follow‐up time interval than it was at baseline. Multitrajectories are displayed as solid lines with 95% CIs in gray dotted lines. Estimated mean values were presented as points and were linked to each other. Four trajectory groups were identified for both sexes: boys (figures at top): Group B1 (12% red lines), Group B2 (38%, green lines), Group B3 (33%, blue lines), and Group B4 (17%, orange lines); girls (figures at bottom): Group G1 (13%, red line), Group G2 (39%, green line), Group G3 (31%, blue line), and Group G4 (17%, orange line). Age‐ and sex‐adjusted BMI‐SDS was calculated based on national pediatric reference data from the KiGGS study
