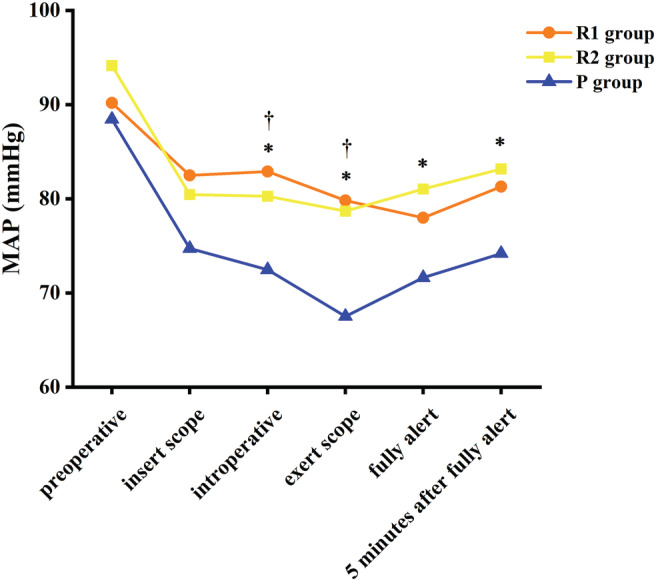
Figure 3.

Mean arterial pressure. †Significant difference between the R1 group and the P group by Tukey honestly significant difference (HSD) between‐group comparison (P < 0.01). *Significant difference between the R2 group and the P group by Tukey HSD between‐group comparison (P < 0.01).
