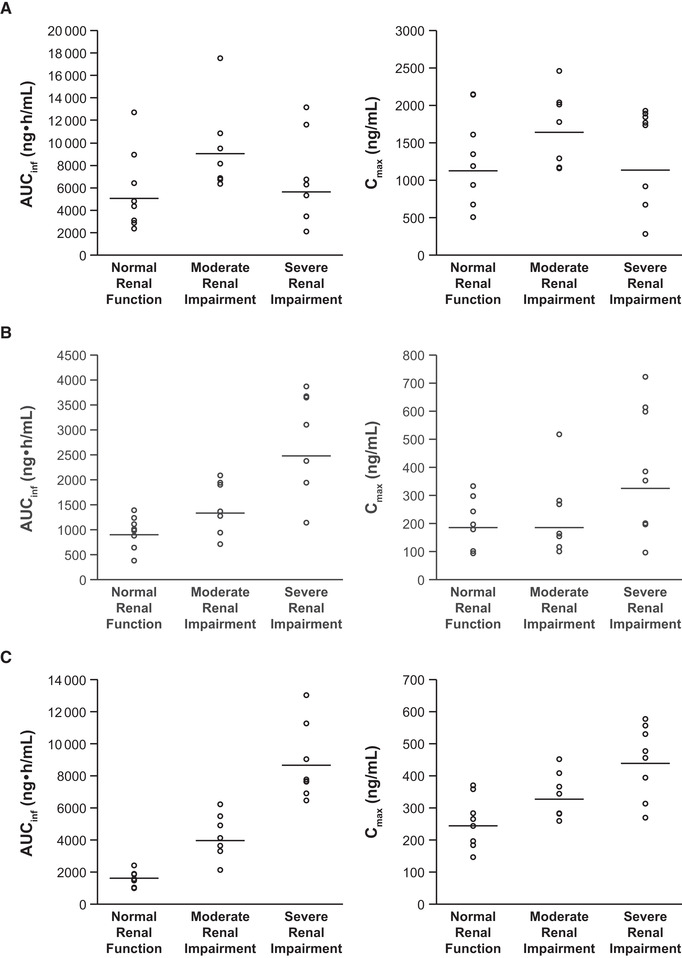
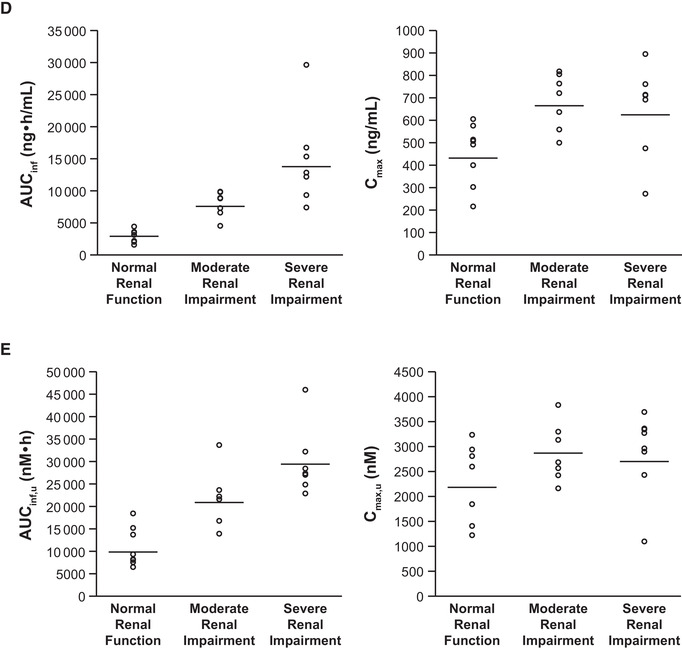
Figure 2.
Scatter plots of individual (open circles) and geometric mean (horizontal lines) AUCinf and Cmax values for abrocitinib (A), M1 (B), M2 (C), M4 (D), and abrocitinib active moiety (E) in subjects with normal renal function, moderate renal impairment, or severe renal impairment. AUCinf, area under the concentration‐time curve from time 0 extrapolated to infinite time; Cmax, maximum plasma concentration.


