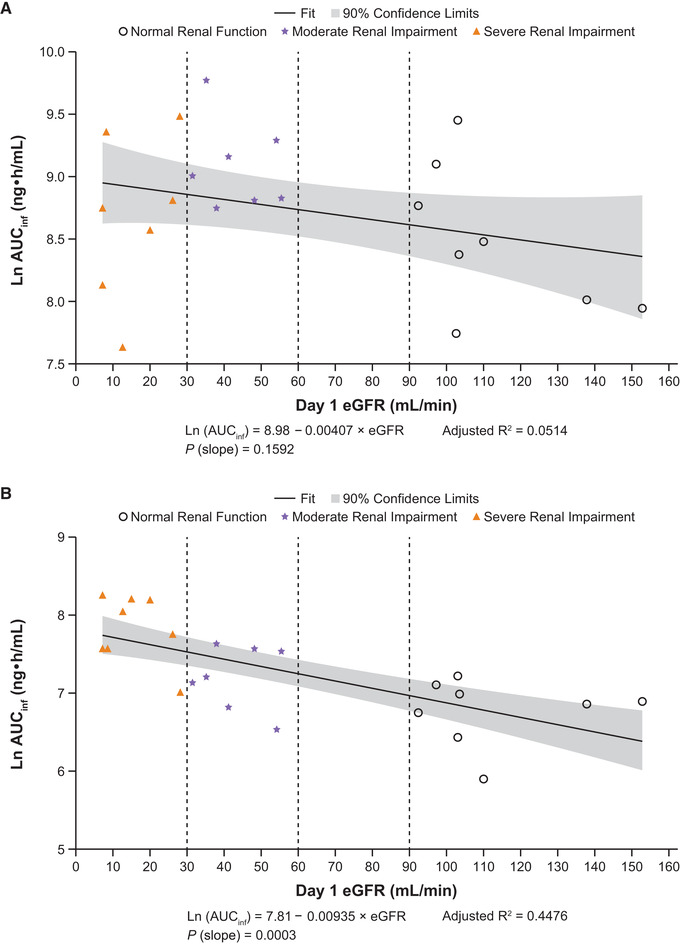
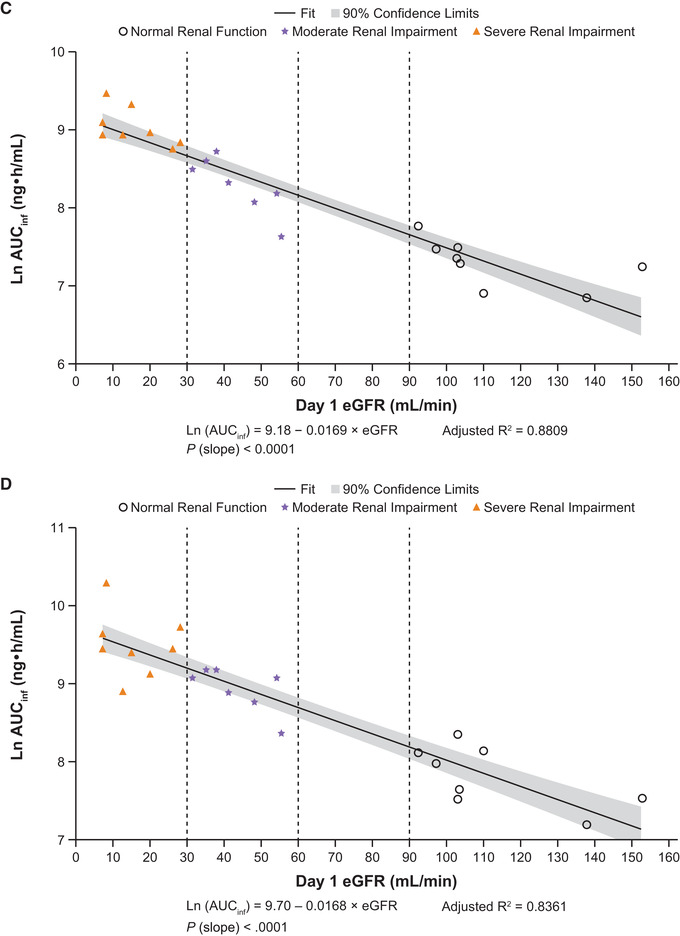
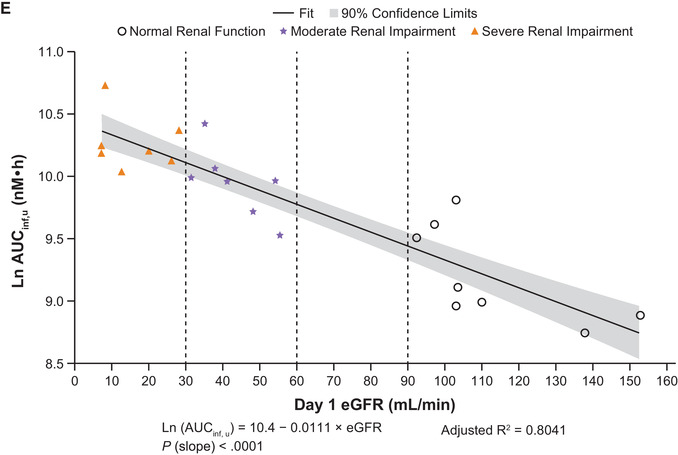
Figure 4.
Linear regression plots of ln AUCinf vs eGFR for abrocitinib (A), M1 (B), M2 (C), M4 (D), and abrocitinib active moiety (E). AUCinf, area under the concentration‐time curve from time 0 extrapolated to infinite time; eGFR, estimated glomerular filtration rate; ln, natural log.


