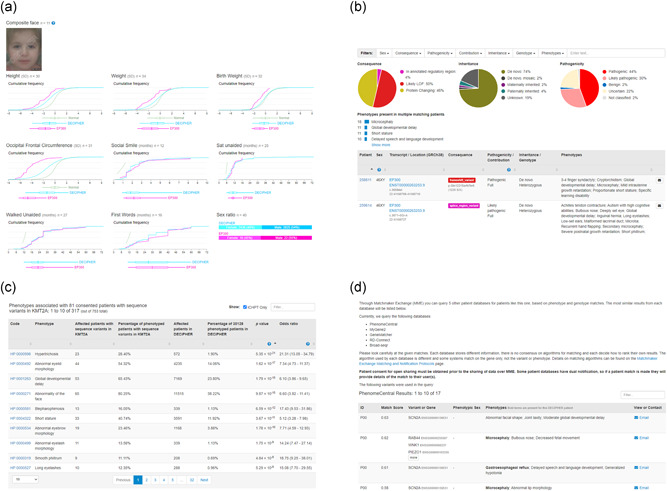
Figure 6.

(A) Quantitative phenotype data (such as developmental milestones or anthropometric measurements) is recorded in DECIPHER and aggregated on a gene‐by‐gene basis. The data is shared openly in a series of graphs that displays expectations for the healthy population (Normal), the DECIPHER population as a whole, and the gene‐specific data. For certain genes, such as EP300 (displayed here), there are composite faces, which highlight facial dysmorphologies. (B) The matching patient interface allows users to view DECIPHER records that overlap a deposited copy‐number, sequence, or insertion variant, or a gene. In this example, the matching patients overlap EP300. Summary information is shown in a series of pi charts, along with phenotypes present in multiple matching patients. The individual patient records are displayed at the bottom of the interface. Filters are available to assist in finding the most relevant patient matches. (C) Within DECIPHER, aggregated phenotype data is used to identify the most discriminating phenotypes associated with disease genes. A table shows the percentage of phenotyped patients with sequence variants in a gene of interest, with a particular phenotype, compared with the percentage of phenotyped patients in DECIPHER with the same phenotype. The odds ratio and p value from Fisher's exact test are displayed. In this example, data for KMT2A is displayed and sorted by p value. (D): Users with write access to an open‐access patient record are able to query the MatchMaker Exchange to search for potential patient matches. DECIPHER is currently connected to Broad‐seqr, GeneMatcher, MyGene2, PhenomeCentral, and RD‐Connect. Details of potential patient matches are displayed within DECIPHER (patient IDs have been removed in this example)
