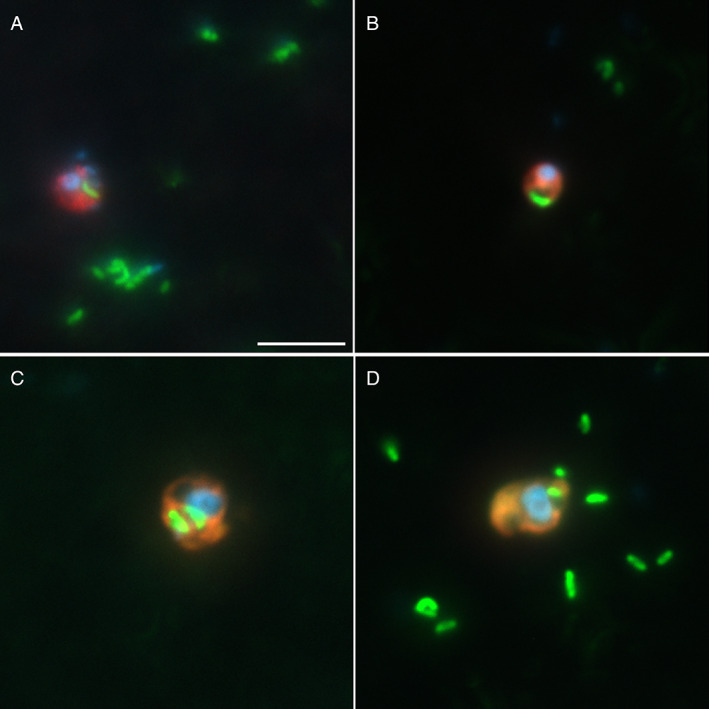
Fig. 3.

Epifluorescence micrographs of cells with ingested FLBs for Minorisa minuta (A), MAST‐4 (B), MAST‐7 (C) and Paraphysomonas imperforata (D). Each image is an overlay of three pictures of the same cell observed under UV radiation (showing the blue nucleus after DAPI staining), green light (red cytoplasm after CARD‐FISH) and blue light excitation (FLB detection). Scale bar is 5 μm and applies to all figures.
