Fig. 5.

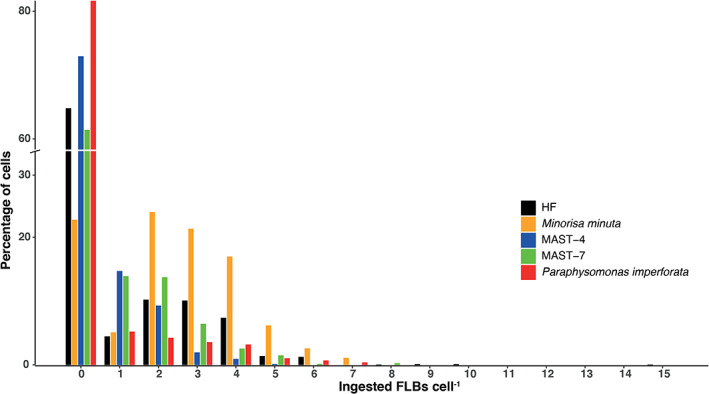
Percentage of cells within five HF groups having different number of ingested FLBs. These numbers are calculated with all cells observed per group at saturating food abundances (the last six bottles of the gradient).

Percentage of cells within five HF groups having different number of ingested FLBs. These numbers are calculated with all cells observed per group at saturating food abundances (the last six bottles of the gradient).