
FIGURE 2.
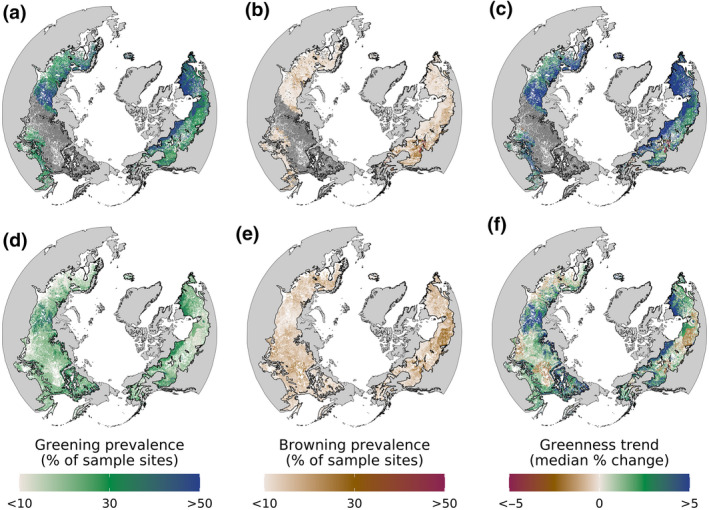
Changes in vegetation greenness during recent decades across the boreal forest biome. Changes in vegetation greenness were assessed from 1985 to 2019 (top row) and 2000 to 2019 (bottom row) at sample sites in recently undisturbed boreal forest using Mann–Kendall trend tests and Theil–Sen slopes. For visualization, the sample sites were grouped (i.e., stratified) and their trends summarized by ecological land unit (ELU), where each ELU is a distinct combination of bioclimate, landform, lithology, and land cover (Sayre et al., 2014). (a, d) Prevalence of greening within each ELU, specifically the percent of sample sites where vegetation greenness significantly (α = .10) increased over each period. (b, e) Prevalence of browning within each ELU, specifically the percent of sample sites where vegetation greenness significantly (α = .10) decreased over each period. (c, f) Overall magnitude of change in vegetation greenness within each ELU characterized by the median total percent change in vegetation greenness over each period. Panels (a, b, d, e) characterize how common significant changes in vegetation greenness were within each ELU, while panels (c, f) characterize the typical magnitude of change in vegetation greenness. There were 431 ELUs in the study domain