
FIGURE 3.
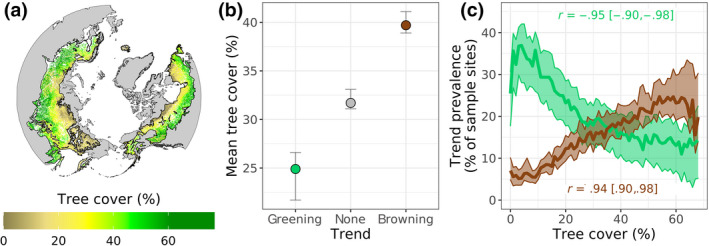
Vegetation greenness trends related to tree cover. (a) Tree cover across the boreal forest biome. (b) Mean tree cover across sample sites where vegetation greenness significantly (α = .10) increased (greening), exhibited no trend, or decreased (browning) from 2000 to 2019. (c) Prevalence (i.e., relative frequency) of greening and browning along spatial gradients in tree cover binned at 1% increments. Correlation coefficients (r) between tree cover and the prevalence of greening and browning. Tree cover exceeded 68% at 1% of sample sites and these were excluded when correlations were computed given the small number of sample sites within each 1% tree cover bin. The panels depict best estimates (dots or lines) and 95% confidence intervals (whiskers or bands) derived from Monte Carlo simulations (n = 103). Tree cover data from the MODIS Vegetation Continuous Fields dataset (DiMiceli et al., 2021)