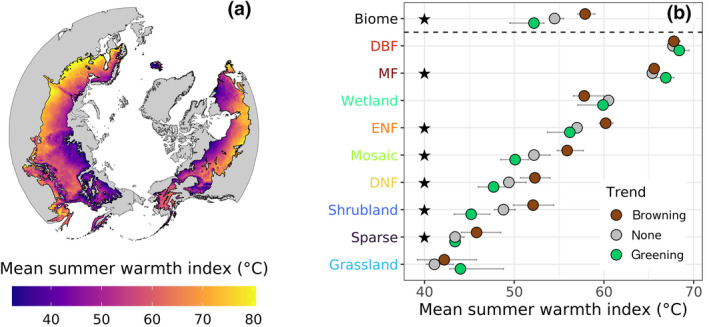
FIGURE 5.

Vegetation greenness trends related to summer warmth by land cover class. (a) Mean summer warmth index (SWI) from 2000 to 2019 with SWI computed as the annual sum of mean monthly air temperatures above 0°C. The SWI is an indicator of total annual heat load. (b) Cross‐site average of mean SWI for sample sites in each land cover class where vegetation greenness increased (greening), had no trend (none), or decreased (browning) from 2000 to 2019. Land cover classes are ordered from highest (top) to lowest (bottom) average mean SWI. Error bars are 95% confidence intervals derived from Monte Carlo simulations (n = 103). Black stars denote significant (α = .05) differences in cross‐site average of mean SWI between greening and browning classes based on permutation tests. The SWI was derived using TerraClimate data (Abatzoglou et al., 2018)
