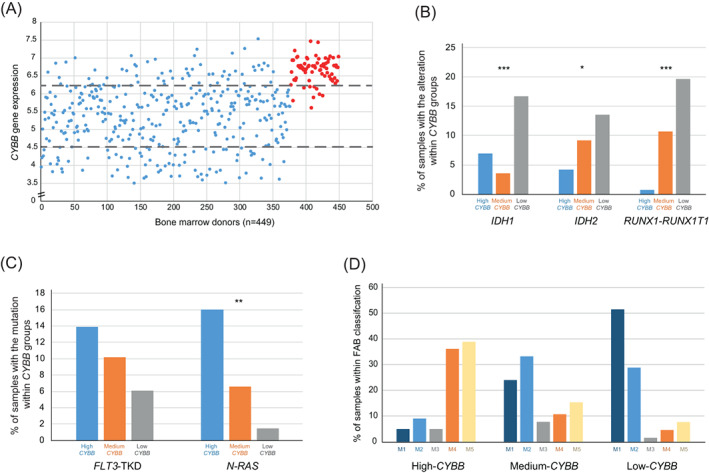
FIGURE 1.

FAB classification, RUNX1‐RUNX1T1 translocation and IDH1, IDH2, FLT3‐TKD and N‐RAS mutations are associated with CYBB in AML patients. (A) CYBB expression levels in bone marrow cells ‐ AML individuals (blue dots) and healthy donors (red dots) ‐ extracted from GSE15061 are shown. Distribution of CYBB‐level groups are also illustrated as a result of cut‐off points drawn in gray: 10th percentile of CYBB expression in healthy donors (upper line) and 25th percentile of AML CYBB expression (lower line). (B) Bar plot representation showing the percentage of GSE14468 samples positive for the mutations IDH1 and IDH2 as well as RUNX1‐RUNX1T1 translocation in each of the CYBB groups. (C) Bar plot representing percentage of GSE14468 samples positive for N‐RAS and FLT3‐TKD mutations in each of the CYBB groups. (D) Bar plot showing percentage of GSE14468 samples classified in each FAB class within CYBB groups. (*) represents p‐value <.05; (**) p‐value <.01 and (***) p‐value <.001 in Chi‐Square test [Color figure can be viewed at wileyonlinelibrary.com]
