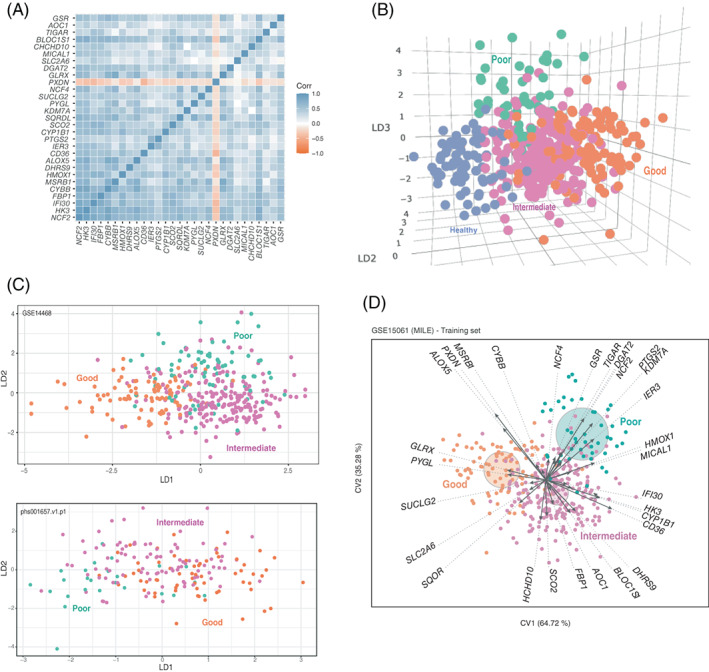
FIGURE 2.

29G is a correlated gene signature that separates AML patients on the basis of prognosis. (A) Pearson's correlation pairwise coefficients (from −1 to 1) of 29G GSE15061 samples were plotted. (B) Dot representation of GSE15061 samples in the three LDA coordinates. LD1, LD2 and LD3 correspond to the discriminant functions obtained in the LDA. (C) Scatter plot data from LDA prognosis group separation is shown for two validation datasets: GSE14468 and phs001657.v1.p1. LD1 and LD2 correspond to the discriminant functions obtained in the LDA. (D) Canonical Biplot representation of the different prognosis samples (good: orange filled dots; intermediate: pink filled dots; and poor: green filled dots) of GSE15061 on the axes 1–2. Discriminant genes (arrows) and confidence circles of each prognosis subtype distribution are plotted based on univariate Student t‐tests to perform post hoc analysis of each gene [Color figure can be viewed at wileyonlinelibrary.com]
