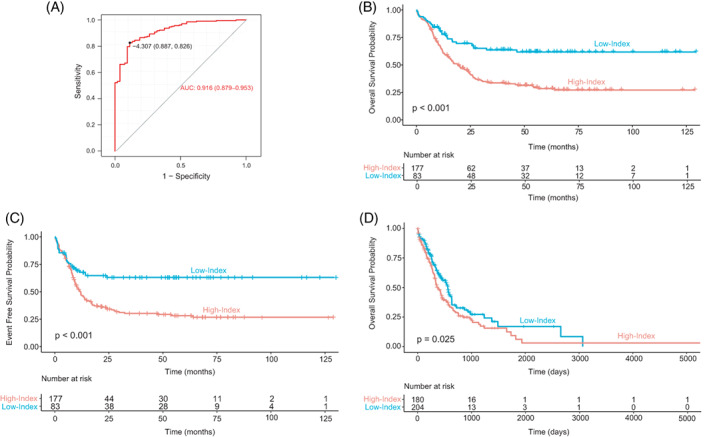
FIGURE 3.

Patients with a low expression index exhibit greater OS. (A) Representation of ROC curve assessment for establishing an appropriate prognosis discrimination cut‐off point for EI in training dataset GSE10358. (B) Kaplan–Meier overall survival (OS) curves of EI groups (High‐Index and Low‐Index) in 260 samples from the GSE10358 dataset. (C) Kaplan–Meier event‐free survival (EFS) curve representation of EI groups (High‐Index and Low‐Index) from 260 samples of the GSE10358 dataset. (D) Kaplan–Meier overall survival (OS) curves of EI groups (High‐Index and Low‐Index) in 429 samples from the phs001657.v1.p1dataset [Color figure can be viewed at wileyonlinelibrary.com]
