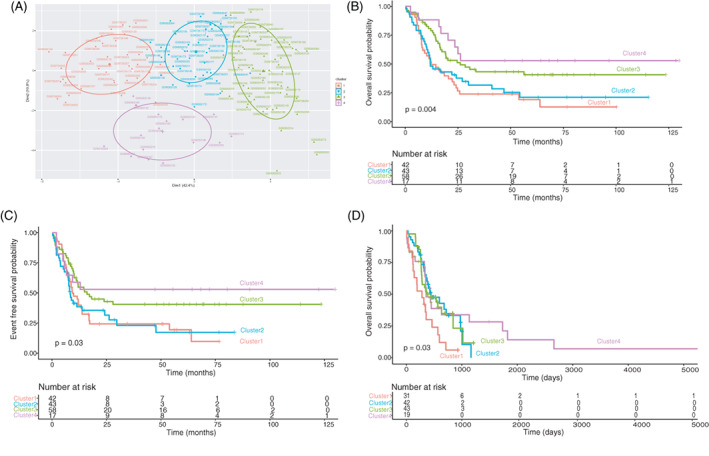
FIGURE 4.

29G based cluster formation in intermediate samples generates four clusters that show differences in OS and EFS. The ability of 29G to discriminate different groups among the intermediate prognosis group was tested on GSE10358 samples (n = 160) and phs001657.v1.p1 (n = 135). (A) PCA representation of the four clusters generated by hkmeans emanated from 29G for intermediate samples of GSE10358 dataset. (B) Kaplan–Meier overall survival (OS) curves of the clusters shown in panel A. Time is expressed in months. (C) Kaplan–Meier event free survival (EFS) curves of the clusters shown in panel A. Time is expressed in months. (D) Kaplan–Meier overall survival (OS) curves of the clusters constituted from intermediate samples of phs001657.v1.p1 following the same procedure as in the training. Time is expressed in days [Color figure can be viewed at wileyonlinelibrary.com]
