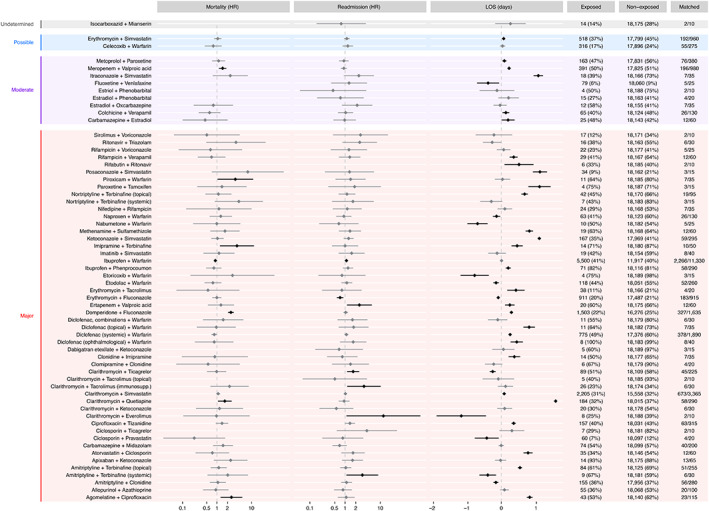
FIGURE 3.

Estimate effect sizes of exposure to discouraged drug pairs and post‐discharge mortality rate (hazard ratio, HR), readmission rate (HR) and length‐of‐stay (change in days). Diamonds show point estimates of the effect sizes, horisontal lines the 95% confidence intervals. The exposed and non‐exposed columns show count (empirical equipoise) and the matched column shows the number of exposed/non‐exposed used to estimate the effects of that pair [Colour figure can be viewed at wileyonlinelibrary.com]
