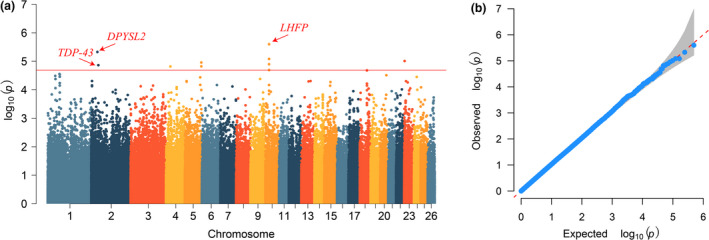
FIGURE 2.

(a) Manhattan plots of the single–locus genome‐wide association study for teat number in Hu sheep. The x‐axis represents the chromosomes, and the y‐axis represents the –log10(p‐value). The dashed lines indicate the thresholds for teat number in Hu sheep (–log10(p) = 4.69). (b) Quantile–quantile (Q–Q) plots of single–locus genome‐wide association study for teat number in Hu sheep. Q–Q plots show the observed vs. expected negative log10 p values.
