
FIGURE 3.
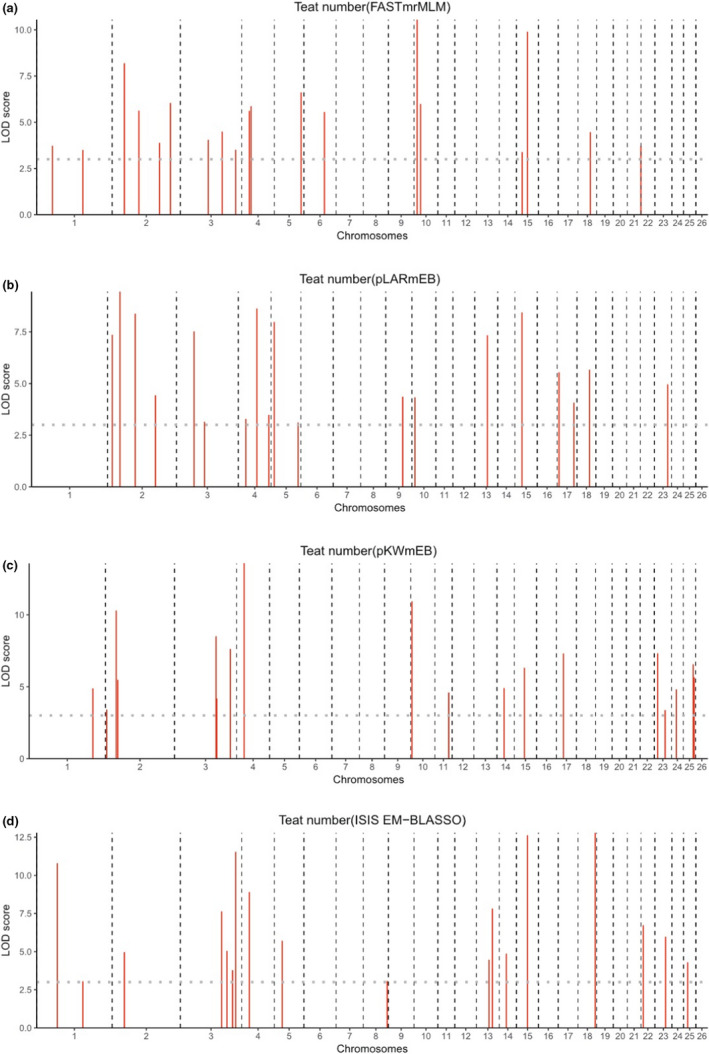
Manhattan plots of the four multi‐locus GWAS for teat number in Hu sheep. For (a–d), the Manhattan plots indicate LOD scores for genome‐wide SNPs (y‐axis) plotted against their respective positions on each chromosome (x‐axis), and the horizontal lines indicate the thresholds for significance (LOD score = 3)