
FIGURE 4.
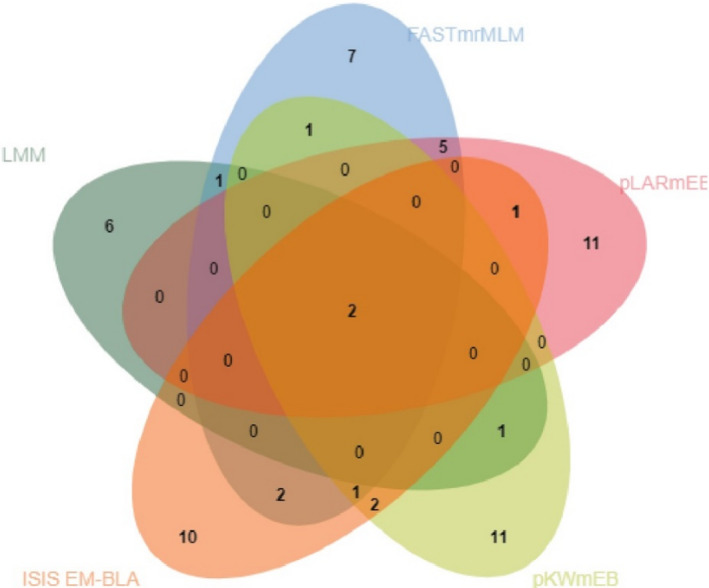
Venn diagrams show the distribution of SNPs from the four multi‐locus methods and also highlight the concordance between single marker method and different multi‐locus methods
Official websites use .gov
A
.gov website belongs to an official
government organization in the United States.
Secure .gov websites use HTTPS
A lock (
) or https:// means you've safely
connected to the .gov website. Share sensitive
information only on official, secure websites.
Venn diagrams show the distribution of SNPs from the four multi‐locus methods and also highlight the concordance between single marker method and different multi‐locus methods