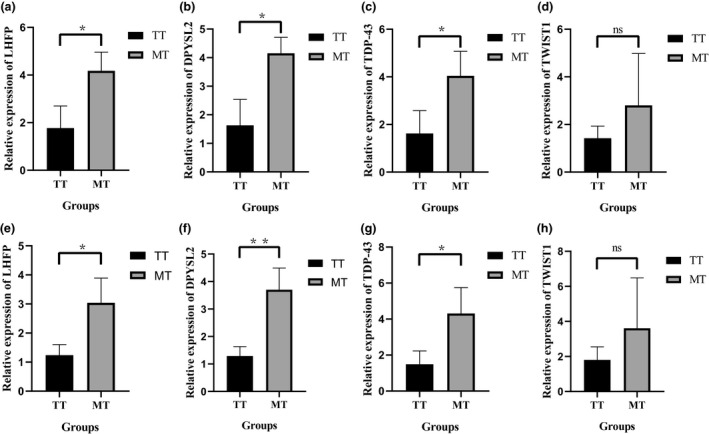
FIGURE 5.

The relative expression of LHFP (a), DPYSL2 (b), TDP‐43 (c), and TWIST1 (d) between TT and MT Hu sheep with GAPDH as reference gene and the relative expression of LHFP (e), DPYSL2 (f), TDP‐43 (g), and TWIST1 (h) between TT and MT Hu sheep with ACTB as reference gene. Panels were plotted based on the results of quantitative real‐time PCR. *means the values of gene relative expression levels are significantly different between the TT and MT groups at the p < 0.05 level. **means the values of gene relative expression levels are significantly different between the TT and MT groups at the p < 0.01 level. (a) p = 0.026; (b) p = 0.015; (c) p = 0.041; (d) p = 0.34; (e) p = 0.028; (f) p = 0.008; (g) p = 0.039; (h) p = 0.35
