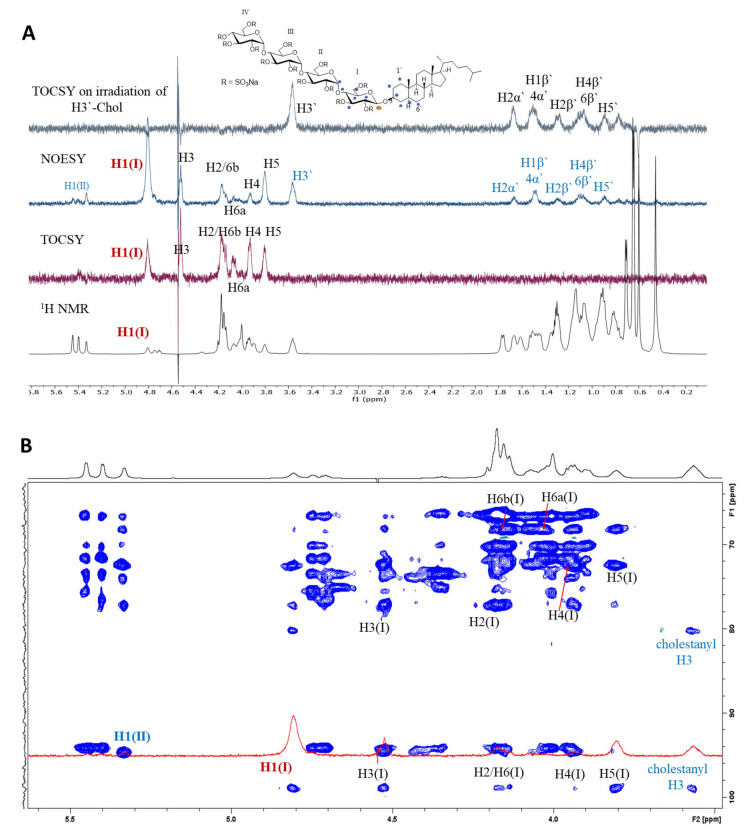
Figure 2.
A) Overlaid 1H, 1D‐TOCSY and 1D‐NOESY spectra of PG545 with selective irradiation of H1 of sugar residue I, and 1D‐TOCSY following irradiation of H3’ of cholestanol (top). Black letters – intra‐residue correlations, blue letters – inter‐residue correlations in 1D‐NOESY. All NOE's are marked on the PG545 structure with blue * while the irradiated proton is marked with red *. B) 2D 1H‐13C HSQC‐TOCSY spectrum (blue) (600 MHz, 298 K) overlaid with 1D NOE spectrum on selective irradiation of H1 of residue I (at 4.81 ppm).

