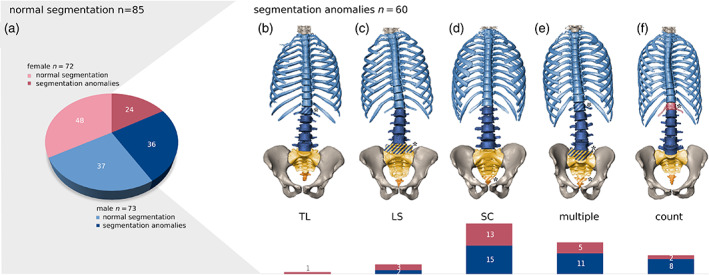
FIGURE 4.

Typical segmentation anomalies. (a) Frequencies of various types of segmentation anomalies at different levels of the spine are shown as pie charts differentiated by sexes (blue, male; red, female). Typical configurations of the spine associated with segmentation anomalies at the (b) thoracolumbar (TL), (c) lumbosacral (LS), (d) sacrococcygeal (SC) level, (e) Multiple border shifts, and (f) true numerical (i.e., meristic) aberrations (count). Corresponding frequency bar charts are shown at the bottom. Out of 145 individuals, 85 possessed the typical spinal count of 12 thoracic (T), 5 lumbar (L), and 5 sacral (S) vertebrae and 60 expressed some type of segmentation anomaly (11–13 T, 4–6 L, and 4–6 S). Transitional vertebrae are marked by a diagonal patterning and an asterisk
