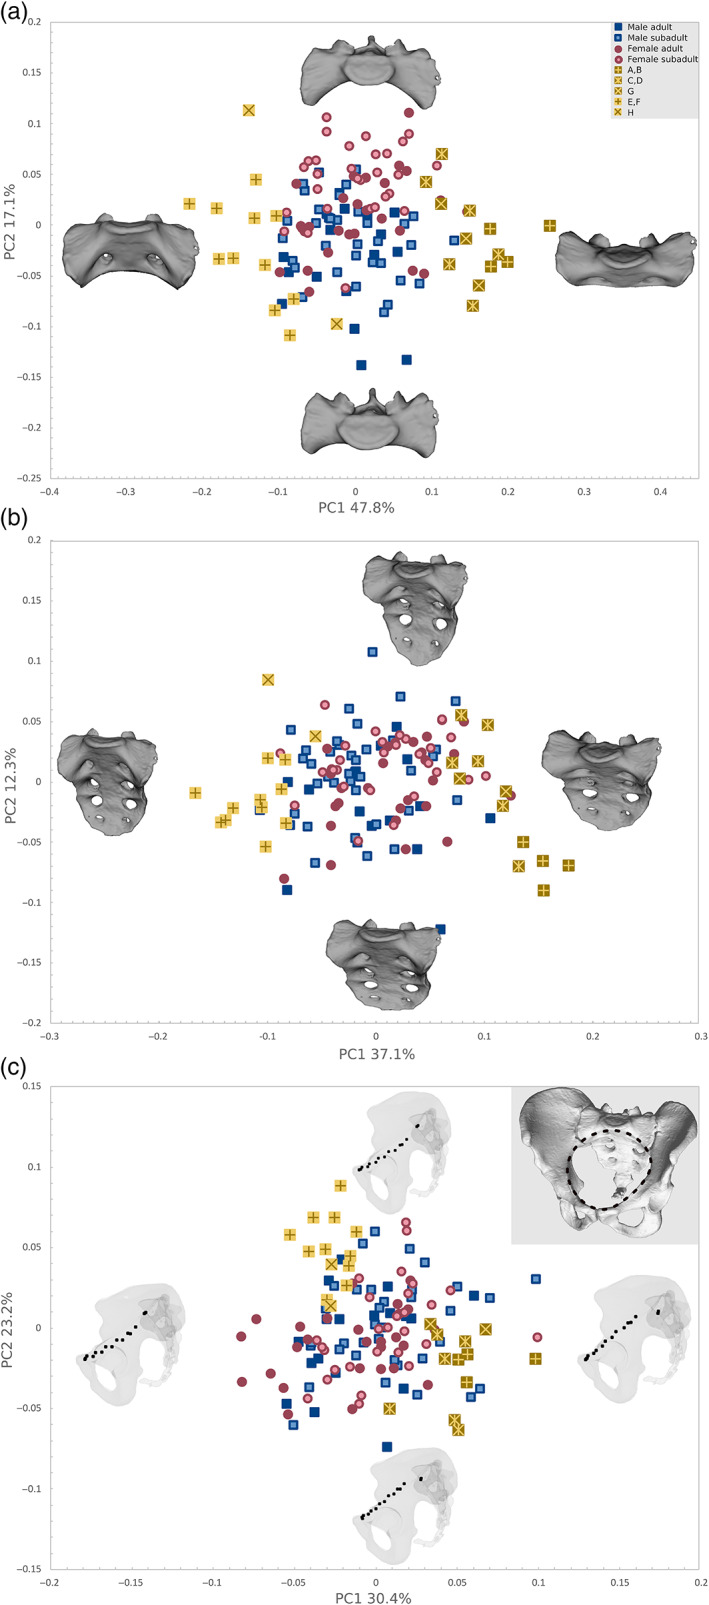
FIGURE 8.

PCA plots of the Procrustes shape coordinates of the landmark configurations representing (a) the first sacral vertebra (S1), (b) the entire sacrum, and (c) the pelvic inlet. The thin‐plate‐spline warps represent the real shape variation at the extremes of the range of distribution along with the first two PCs. Note that the S1 configuration is best suited to distinguish segmentation anomalies along PC1, additionally showing a slight separation of males and females along PC2. (adult males, blue filled squares; subadult males, blue empty squares; adult females, red filled circles; subadult female, red empty circles; different shades of yellow squares correspond to sacral segmentation anomalies as represented in Figure 7: Dark yellow with cross, complete and partial lumbarization (a, b); dark yellow with star, partial and complete sacralization (c, d); dark yellow x, sacrum with four sacral elements (g); light yellow cross, different stages of incomplete lumbarizations (e, f); light yellow x, sacrum with six sacral elements (h). PCA, principal component analyses
