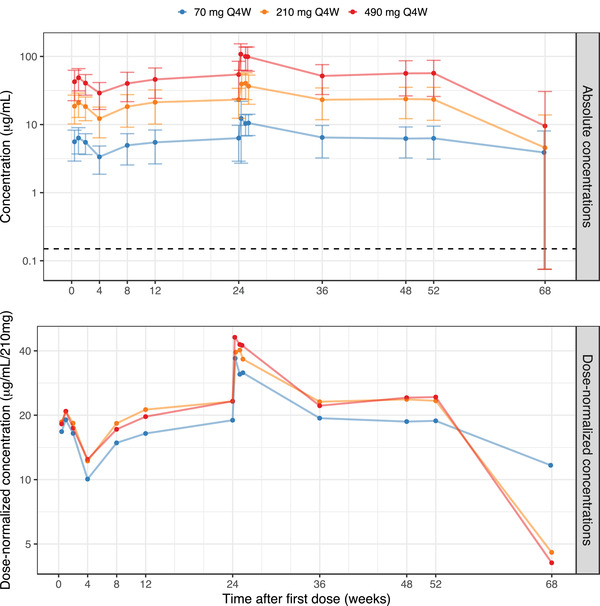
Figure 1.

Observed mean astegolimab serum concentrations versus time, based on the PK analysis data set, on a semilogarithmic scale. The upper panel shows absolute concentrations and the lower panel concentrations normalized to the 210‐mg dose. Filled circles represent the mean per dose and visit, with error bars as ± SD (upper panel). All sampling time points within a treatment arm have been connected by a line. Sampling time points are at trough except for the PK profiles after the first dose and after the week 24 dose, as well as the sample at week 68 (20 weeks after the most recent dose). For the week 68 visit the SD was larger than the mean, in all 3 arms, but the lower limits were depicted at LLOQ/2. The horizontal broken line marks the LLOQ (upper panel). LLOQ, lower limit of quantification; Q4W, every 4 weeks; SD, standard deviation.
