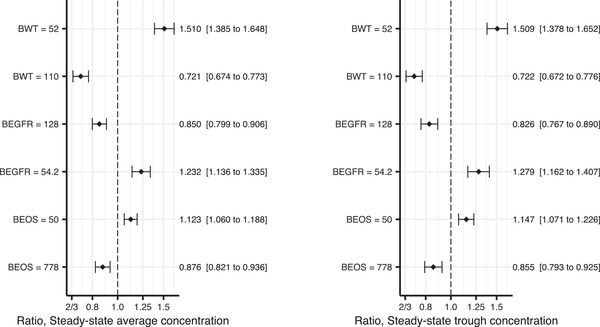
Figure 3.

Forest plot showing the final population PK model estimates of covariate effects on the steady‐state exposure for 490‐mg every‐4‐weeks dosing: average concentration in left panel and trough concentration in the right panel. The impact has been shown for the 2.5th and 97.5th percentiles of the covariate (across the subjects in the PK analysis data set), and in relation to the median covariate value. The vertical, dashed line is marking no change (a ratio of 1), compared to the reference patient. The x‐axis is on log scale, since ratios 2/3 and 1.5 are of corresponding impact, just as ratios 0.8 and 1.25 are. The closed symbols represent the point estimates and the whiskers represent the 95%CI, based on the NONMEM covariance matrix (10 000 bootstrap samples). The numbers on the right hand of the plot represent point estimates (95%CIs) of the change in the parameter compared to the reference patient (with baseline values: 79 kg body weight, 87.9 mL/min/1.73 m2 eGFR and 180 eosinophil cell count/μL). BEGFR, estimated glomerular filtration rate at baseline; BEOS, blood eosinophil level at baseline; BWT, body weight at baseline; CL, clearance; Q, intercompartmental clearance; Vc, central volume of distribution; Vp, peripheral volume of distribution. *The effect of body weight was implemented as a shared effect (coefficient) between CL and Q, and between Vc and Vp, respectively.
