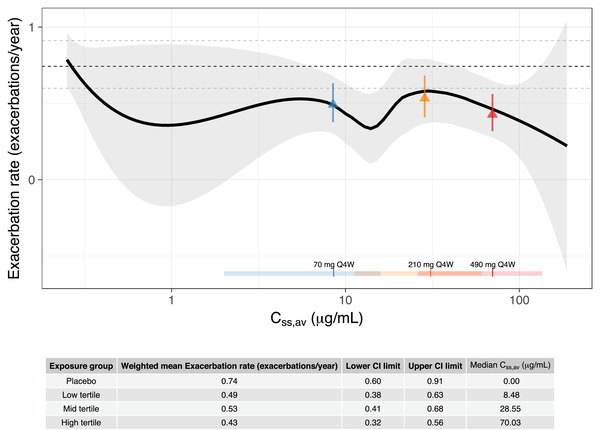
Figure 4.

Exacerbation rate versus Css,av on a semilogarithmic scale. The solid line is a loess smooth where the shaded area represents the 95%CI of the smooth. The vertical lines and horizontal bars, at the bottom of the graph, are the median and range (2.5th and 97.5th percentiles) of the distribution of individual predicted Css,av in the 70‐mg every‐4‐weeks (blue), 210‐mg every‐4‐weeks (yellow), and 490‐mg every‐4‐weeks (red) dose groups, respectively. The dashed, black horizontal line shows weighted mean exacerbation rate for the placebo group and the dashed gray lines show the corresponding 95%CI (exact Poisson CI). The triangles show weighted mean exacerbation rate in Css,av low (blue), mid (yellow), and high (red) tertile groups with error bars showing the corresponding 95%CI (exact Poisson CI). Css,av, average concentration at steady state; Q4W, every 4 weeks.
