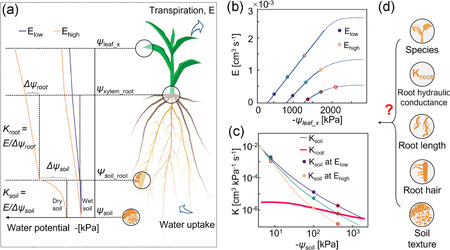
Figure 1.

Schematic of water flow in the soil–plant continuum and corresponding variation of root and soil hydraulic properties during soil drying. (a) Water potential gradients from soil to leaf at low and high transpiration rates (E) in wet and dry conditions. ψ soil, ψ soil_root, ψ xylem_root, and ψ leaf_x are the water potentials in the soil, at the soil–root interface, root xylem and leaf xylem, respectively. Δψ soil and Δψ root are potential differences between soil and soil–root interface, and between soil–root interface and root xylem. K soil and K root are the soil and root hydraulic conductance. (b) Relation between E and ψ leaf_x in drying soil (for a hypothetical crop ca. 1‐month‐old). Dashed lines are from soil hydraulic nonlinearity. (c) Hypothetical relation between K soil and K root at different transpiration rates in drying soil. Declines in K soil and K root during soil drying cause nonlinearity in the relation between E and ψ leaf_x. Circle symbols with blue and red edges are for wet and dry conditions. (d) In this study, we explored how soil textures and root hydraulic phenotypes (e.g., root hydraulic conductance, root length, and root hairs from different species) impact root water uptake in drying soils [Color figure can be viewed at wileyonlinelibrary.com]
