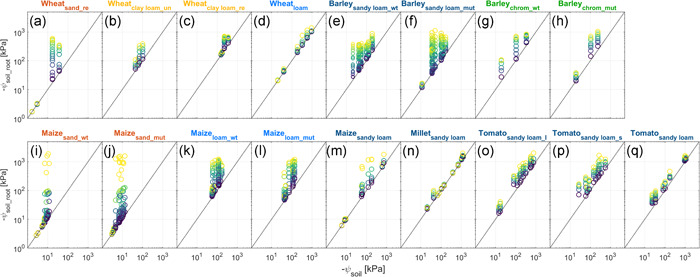
Figure 4.

Variation of water potential at the soil–root interface (ψ soil_root) with increasing transpiration rates (from dark blue to yellow, note that same colour does not mean same transpiration rate) as a function of soil matric potential (ψ soil). (a,b,c,d) Wheat grown in repacked sand, undisturbed clay loam, repacked clay loam, and loam. (e,f) Wildtype and mutant (roothairless brb) barley grown in sandy loam. (g,h) Same barley genotypes as (e,f) grown in chromosol soil. (i,j) Wildtype and mutant (roothairless 3) grown in sand. (k,l) Same maize genotypes as (i,j) grown in loam. (m) Maize grown in sandy loam. (n) Millet grown in sandy loam. (o,p) Tomato with long and short root length grown in sandy loam, respectively. (q) Tomato grown in sandy loam. chrom, red chromosol soil; l, long root system; mut, mutant; re, repacked; s, short root system; un, undisturbed; wt, wild type. The same colour is used for similar soil textures [Color figure can be viewed at wileyonlinelibrary.com]
