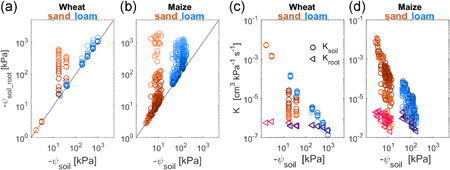
Figure 5.

Comparison of water potential at the soil–root interface and of soil and root hydraulic conductance between sand and loam. (a,b) Water potential gradient at the soil–root interface (ψ soil_root) with increasing transpiration rate and soil (ψ soil) in sand and loam for both wheat and maize (from Figure 4a,d,i–l). (c,d) Difference between soil hydraulic conductance (K soil) with increasing transpiration rate and root hydraulic conductance (K root) in sand and loam for both wheat and maize [Color figure can be viewed at wileyonlinelibrary.com]
