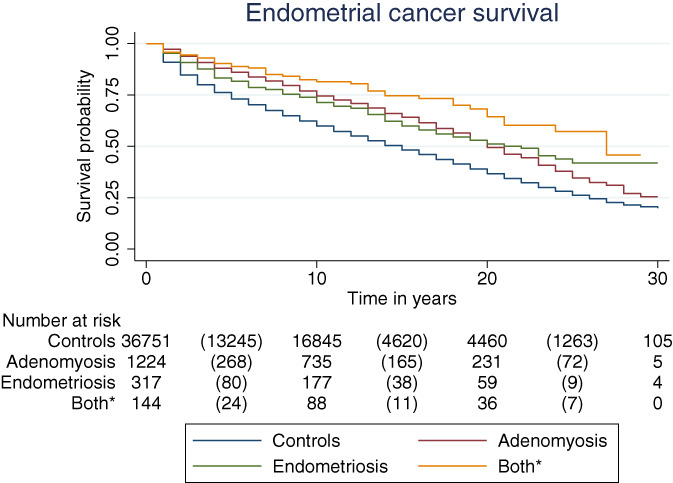
FIGURE 2.

Kaplan‐Meier curve of overall survival, by endometriosis/adenomyosis status. *Both endometriosis and adenomyosis. Comparing all endometriosis/adenomyosis cohorts separately with the control cohorts resulted in a P‐value < .0005. Comparing the endometriosis/adenomyosis cohort did not result in P‐value smaller than .005 [Color figure can be viewed at wileyonlinelibrary.com]
