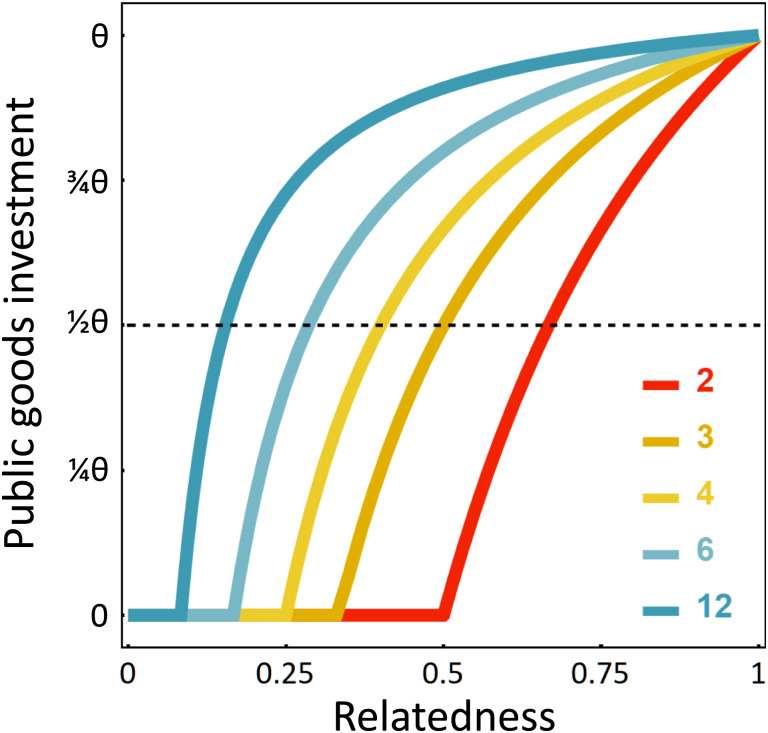
Fig. 1.
A player’s investment in public goods as a function of their relatedness to the group. The different lines correspond to different benefits relative to costs (b/c) (see inset legend). Each line corresponds to a value of whenever ri > c/b, and a value of 0 otherwise. The y axis scales investment relative to that which optimizes group fitness (θ).

